.svg)


Usage-based pricing and hybrid pricing models have become very popular in the SaaS industry in recent years because they better align the price that customers pay for SaaS products with the value they get from using them.
While this alignment has several business benefits, the unpredictability inherent in these models make forecasting revenue more challenging than it is with traditional subscription-based pricing.
This article will show you how to forecast revenue more accurately when your pricing model includes one or more usage-based components.
Given the growing popularity of usage-based pricing models today, whether to implement usage-based pricing is a top-of-mind question for many SaaS business leaders.
If you’re considering the benefits to switching to a purely usage-based pricing model or a hybrid model, it’s important to also consider the complexities it will introduce into your business. Revenue forecasting is a big one.
This article will explain the challenges of forecasting revenue when all or part of your pricing model is usage-based pricing model and provide a method for doing that more accurately.
Why usage-based pricing is so complex
SaaS pricing is a pretty complex topic, and to make it even harder to understand, there is no single definition for “usage-based pricing”. Of course, this makes sense given the many different ways a SaaS business can build its pricing model.
To provide some context for our discussion of revenue forecasting with usage-based pricing models, we broadly define three main categories of SaaS pricing:
- Subscription-based pricing: This type of pricing model, which has long been a mainstay in the SaaS industry, is based on a set monthly (or sometimes annual) fee that does not change over the course of the subscription.
- Usage-based pricing: With this pricing model, price varies from month to month based on how many “units” of product a customer uses or consumes.
- Hybrid pricing: A hybrid pricing model combines different types of pricing, such as a combination of subscription-based pricing with a usage-based component or a combination of two or more usage-based components.
For many SaaS companies, usage-based pricing has emerged as an effective strategy to align costs with consumption, providing transparency and flexibility to customers and better visibility to businesses.
Tiered pricing models are a variation of usage-based pricing in that instead of prices being directly based on consumption, they are based on a range of consumption up to some maximum amount. Depending on the details of the pricing structure, when that amount is exceeded, the customer would either upgrade to the next higher tier or pay for overages on the current tier.
SaaS businesses often adopt tiered-pricing models that offer multiple "packages" with different combinations of feature offerings and price points, e.g., basic, premium, and enterprise, which cater to different customer types. This type of usage-based pricing enables low-ticket customers to onboard with basic features and gradually move up to higher tiers as their needs grow.
Given all this variability associated with usage-based pricing, it’s easy to see how forecasting revenue can be challenging for business leaders.
The difficulty in revenue forecasting with usage-based pricing
Revenue forecasting is an essential part of financial planning for CXOs. Forecasting lends a level of predictability to the business, allowing companies to more effectively manage expenses and make adjustments when needed to ensure the business stays on track.
However, usage-based pricing models are inherently unpredictable. For SaaS companies, this makes monthly recurring revenue (MRR) more difficult to predict, which can create cash flow challenges.
Annual recurring revenue (ARR) is also more difficult to predict. ARR refers to the recurring revenue from subscriptions, normalized on an annual basis, that a SaaS company expects to receive from its customers. ARR is a metric that was developed based on the subscription-based pricing model for business with predictable, recurring revenue, not the kind of revenue you get with usage-based pricing.
While it is possible to forecast ARR with usage-based pricing models and its impact on net revenue retention (NRR), it’s far more complex than forecasting subscription-based ARR.
This is because usage-based revenue is not ARR. Usage-based revenue isn’t (necessarily) recurring revenue because the amount that customers pay varies from month to month.
This would be true for any purely usage-based pricing model. However, with some hybrid models, it is possible for revenue to have both an ARR component and a non-recurring, usage-based component.
For example, if your pricing model includes both a base subscription and monthly usage fees on top of that, the revenue from the base subscription would be reported as ARR while the usage-based component would be considered non-recurring revenue. In these cases, it makes sense to forecast both components of the pricing model separately and then add the results.
As with any forecasting effort, especially when you’re forecasting something as complex as usage-based revenue, it’s important to find the right balance between the accuracy of your forecast and the time required to achieve it. In the next section, we’ll show you a usage-based revenue forecasting model that can help you do that.
How to forecast usage-based revenue with a cohort analysis
Whether you're evaluating usage-based pricing models or already using one, a cohort analysis provides an excellent framework for understanding how usage-based pricing will impact your revenue.
With a cohort analysis, SaaS business leaders can look at their customers in different ways to understand various aspects of their behavior as it relates to usage. This can provide powerful insights that can help leaders determine the steps necessary to grow and expand customers’ use of the products, reduce churn rates, and increase customer lifetime value (LTV).
For businesses with usage-based pricing, cohort analysis can also reveal usage patterns that finance leaders can use to create more accurate forecasts.
In the SaaS context, the term “cohort” typically refers to customer segments that share a common characteristic. For example, you can define your customer cohorts based on the geographic region in which they’re located or by market segment. You can define your cohorts based on any homogeneous characteristic of a customer group.
When forecasting usage-based revenue, it is useful to define your customer cohorts based on when the customer was acquired. So, for example, all the customers who signed up in January 2024 for your product would be known as the January 2024 cohort.
Defining cohorts in this way allows you to track that group of customers over time to identify trends that you can use to inform your revenue forecast. This is particularly useful for usage-based revenue forecasting because revenue is inextricably tied to customer behavior. That is, the amount of money you make from a given cohort is a function of how much, collectively, the customers in that cohort are using the product.
Cohort analysis is – hands-down – the best way to forecast usage-based revenue.
Cohort analysis not only gives you key insights into how your usage-based revenue fluctuates from month to month, it also provides a retention curve that you can apply to more accurately forecast usage-based revenue in the future. You can also use that retention curve to forecast any number of other variables, too.
Here’s a high-level overview of the process we describe below:
- Use historical data for customer acquisition and retention to define your customer cohorts and model a customer retention curve.
- Use the results from the above step to forecast monthly customer acquisition and retention for future months.
- Use historical data to calculate an average usage per customer and multiply that by price per unit to get the average usage-based revenue per customer. Here, you can apply that average to your forecast or calibrate it based on additional information.
- Multiply the average usage-based revenue per customer for each month of the forecast period by the predicted number of new and retained customers for each new cohort to get the total forecasted revenue.
Step 1. Define customer cohorts and model the customer retention curve
Here’s what a cohort analysis might look like in a spreadsheet:
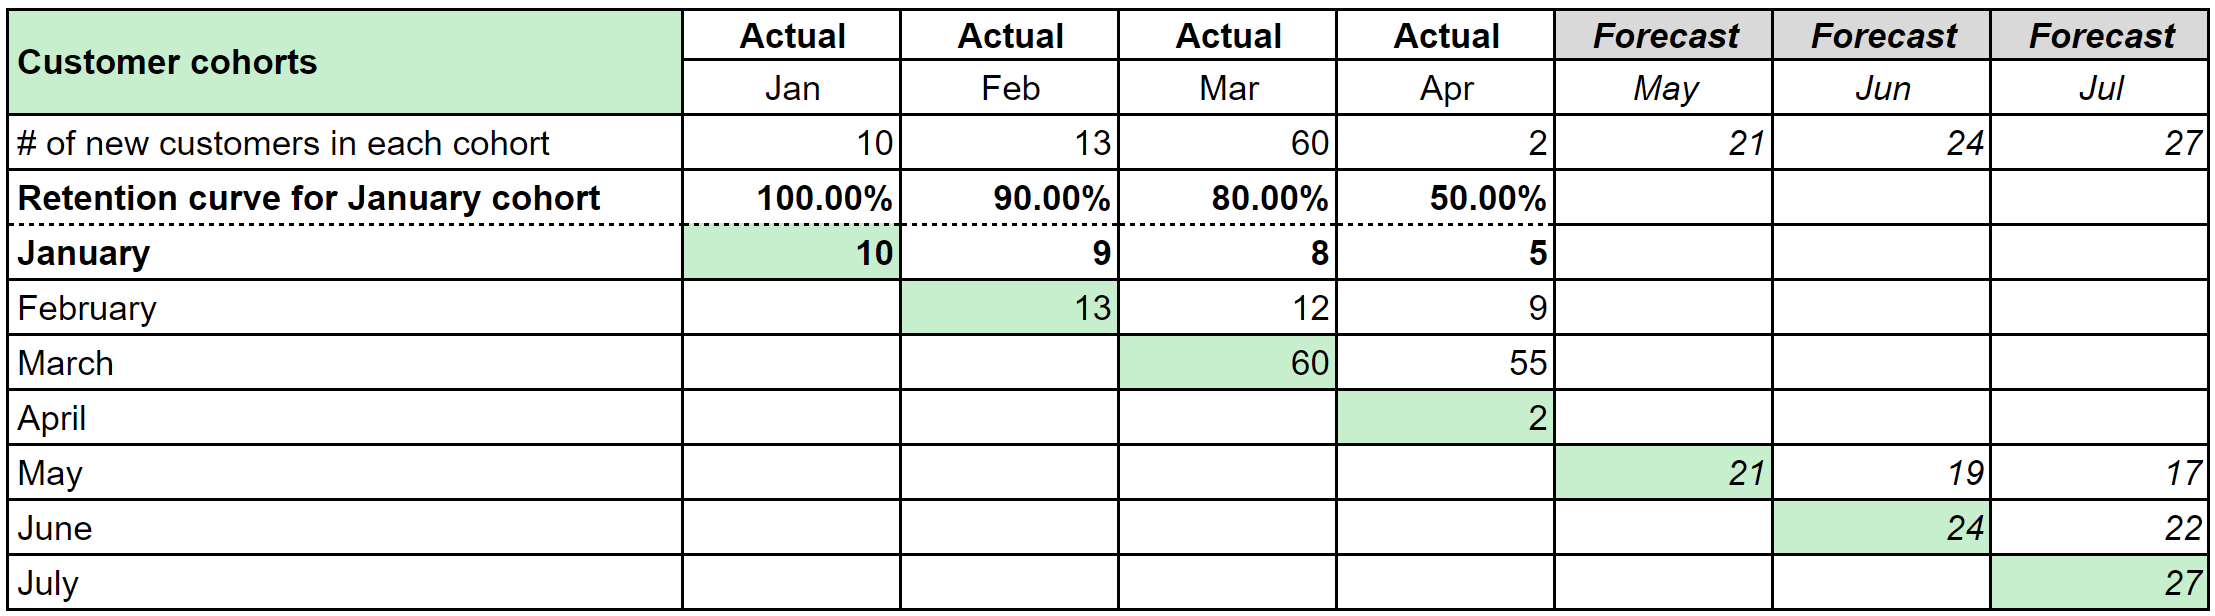
In this example, we’re using historical data (actuals) for the number of new customers acquired each month from January through April.
There are a couple of things to note in this table:
- The row labeled “Customers” shows the number of new customers acquired each month, each of which will be their own cohort. In January, February, March, and April, we acquired 10, 13, 60, and 9 new customers, respectively.
- Each of these cohorts has its own row that tracks how that cohort changed over time in terms of retention.
The retention curve shown is for the January cohort and shows how many of the original 10 customers in the cohort remained each month in terms of a percentage. Looking across the row that represents the January cohort, we can see that from the 10 original customers we acquired, nine remained in February, then another one churned in March leaving you with eight. By April, only five of the original customers you acquired in January remained.
These changes reflect our retention rate, which is calculated for each month by dividing the number of customers retained by the number of customers in the original cohort.
In this example, the monthly retention rates for the January cohort are 90% for February, 80% for March, and 50% for April. Together these percentages reflect our retention curve for the January cohort.
Step 2. Forecast monthly customer acquisition and retention for future months
Now that we have our data organized in this way, we can use our results for the January cohort to forecast the number of new customers we can expect to acquire in May, June, and July.
In this example, we’re using the January cohort to determine this because with four months of actuals, it offers the most reliable results to use as an assumption in this particular model. This approach also assumes that your customer acquisition will follow the same trend as it did in the first four months (January through April).
To forecast the number of new customers we will acquire each month, we’ll use a rolling average of the actuals data from the immediately preceding months:
- The number of new customers in May is forecasted at 23 based on the average of the actuals for January to April.
- The number of new customers in June is forecasted at 26 based on the average of the actuals for February to April.
- The number of new customers in July is forecasted at 30 based on the average of the actuals for March and April.
Using a rolling approach is a good starting point. However, it’s always a good idea to calibrate these averages based on any other information you have that could affect the results, such as economic outlook, known seasonality in your sales, etc.
Now that we have a forecast for the number of new customers our May, June, and July cohorts will start out with (calibrated to the extent possible based on other relevant information), we need to determine how many of those customers each cohort will retain over time.
To do that, we will apply the retention curve percentages (retention rates) that we calculated with the actuals for our January cohort to predict the expected behavior of our forecasted cohorts for May through July (i.e. how many of the new customers in each cohort we will retain).
The retention rate for our January cohort was 90% in the first month, 80% in the second month, and 50% in the third month. We can apply this behavior to the first, second, and third months of each of our forecasted cohorts to predict how many customers each cohort will retain over time. For example, in the first month of our May cohort, we would expect to retain 90%, or 19 of the 21 new customers we acquire. In the second month, we would expect that number to be 80%, or 17 of those customers, and so forth.
At this point you’re probably wondering, how is this approach—forecasting and analyzing customer cohorts—connected to forecasting usage-based revenue? Once you have forecasted the number of new customers you will acquire with each new cohort and how many of those customers you can expect to retain over time, there’s one more piece of information you need to forecast usage-based revenue.
Step 3. Determine the historical average usage-based revenue per customer
If you have enough historical usage data to calculate monthly averages for the usage-based component(s) of your pricing, you can use those averages with the results of your cohort analysis to forecast usage-based revenue.
Here’s what that looks like:
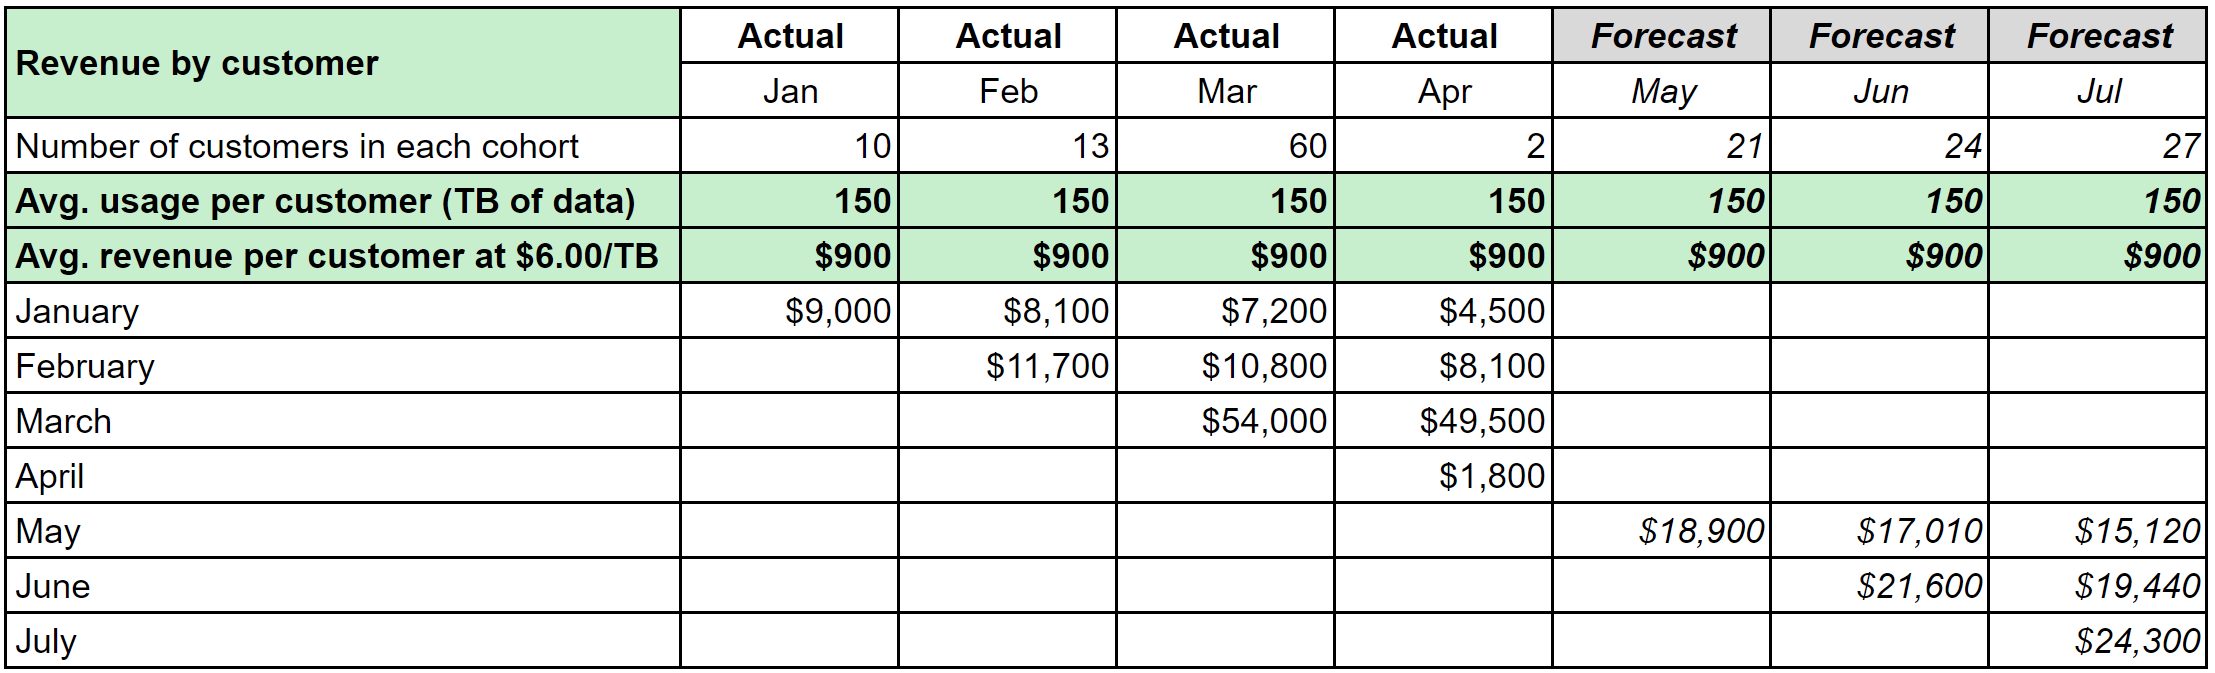
In this example we use terabytes (TB) of data as the usage-based component of pricing. Historical data is needed to determine the average usage per customer. Then, we use the basic price times quantity (PxQ) formula, multiplying the average usage per customer by the price per unit to get the average revenue per customer.
For simplicity, we used the same average usage for all months. However, if your analysis of historical data reveals that the average varies from month to month, you could apply the same averages to your forecast depending on how confident you are that those averages are likewise representative of what you can expect for the forecast period.
This approach can be used with any usage-based pricing component, such as the average number of seats each customer uses, the average number of API calls, or in the case of an email service provider, the average number of contacts in the customer’s database.
Step 4. Forecast the usage-based revenue over time for each new cohort
To forecast our usage-based revenue, we multiply the forecasted number of customers in each cohort each month (as determined by our cohort analysis) by the forecasted monthly average revenue per customer.
Alternatives to cohort analysis
Cohort analysis works well when you have historical data. But, what do you do when you don’t have access to historical usage trends. For example, when you’re entering a new market or are planning to introduce a new product?
In this situation, you can use other assumptions or inputs to forecast usage-based revenue, such as:
- Sales-provided estimates based on their interactions with prospects
- Macroeconomic estimates
- Even estimates from customers (if you were to ask them about their plans for future/continued product usage)
Note that while the examples discussed above explain the “how-to” process of forecasting usage-based revenue, they are also relatively simplistic. The more complex the usage-based pricing model is, the more complex the forecasting process.
Challenges in forecasting ARR and revenue with usage-based pricing models
Its importance notwithstanding, forecasting usage-based revenue presents a number of challenges for today’s SaaS CFO.
Data chaos
Typically, the factors considered in traditional revenue forecasting include historical sales data, economic indicators, seasonality, and customer behavior. While it may seem cumbersome, this process can be automated and organized.
On the other hand, as a service provider, when you have a usage-based pricing model, rather than collating data from a single document that houses the monthly invoices for all customers, finance teams need to gather and reconcile (customer usage) data from disparate sources (e.g., spreadsheets, BI tools, CRM, etc.) for all individual customers and/or each customer cohort.
This process is all the more time consuming, often manual, and prone to errors. The variability in data formats/structures across different systems can also complicate the analysis, leading to inaccuracies and potential forecasting errors.
Revenue without fixed annual contracts
In the absence of fixed annual contracts, businesses need to engage more frequently with customers to understand and maintain their usage, which in turn helps maintain the revenue.
This type of customer engagement enables finance teams to anticipate any changes in consumption and make adjustments to the forecast. However, maintaining the efficiency of these ongoing interactions can strain an already stretched finance or the customer service teams, especially for those SaaS businesses with a large customer base or even those operating in sectors with rapid consumption fluctuations.
Departmental silos
The disconnect between sales, operations, and finance teams can be regarded as a third challenge. Different departments might build their own forecasts, using their preferred models on spreadsheets.
Reconciling these department-level forecasts in the larger financial forecasting model and ensuring alignment across teams can be quite time-consuming and redundant. By the time you’re done, some of the numbers in the original forecasts might have changed, leading to inaccuracies.
For example, sales teams are typically focused on driving revenue growth and tracking metrics, such as new bookings, growth, and churn. Meanwhile, finance teams focus on building and adjusting forecasting models with their own data. This lack of collaboration may lead to unnecessary lags and inefficiencies.
Technology is essential for effective revenue forecasting with usage-based pricing models
While the most efficient method for forecasting usage-based revenue for your SaaS company is to use a cohort analysis, the spreadsheet example we provided here is a very simple one that does not begin to capture all the complexity of implementing the model at scale.
The first problem is tracking your customer cohorts. Defining monthly cohorts based on the customers acquired in that month and tracking retention over time can quickly become extremely challenging because every month is a new cohort to track. Revenue planning software can really help here with automations that can consolidate your data from multiple sources in real time, virtually eliminating the burden of pulling together all the historical data you need for your forecasting effort and verifying its accuracy with data owners.
The next big challenge is the modeling effort and the complexity of the formulas needed to do your cohort analysis for potentially hundreds of cohorts and to apply the results of that analysis in your forecast.
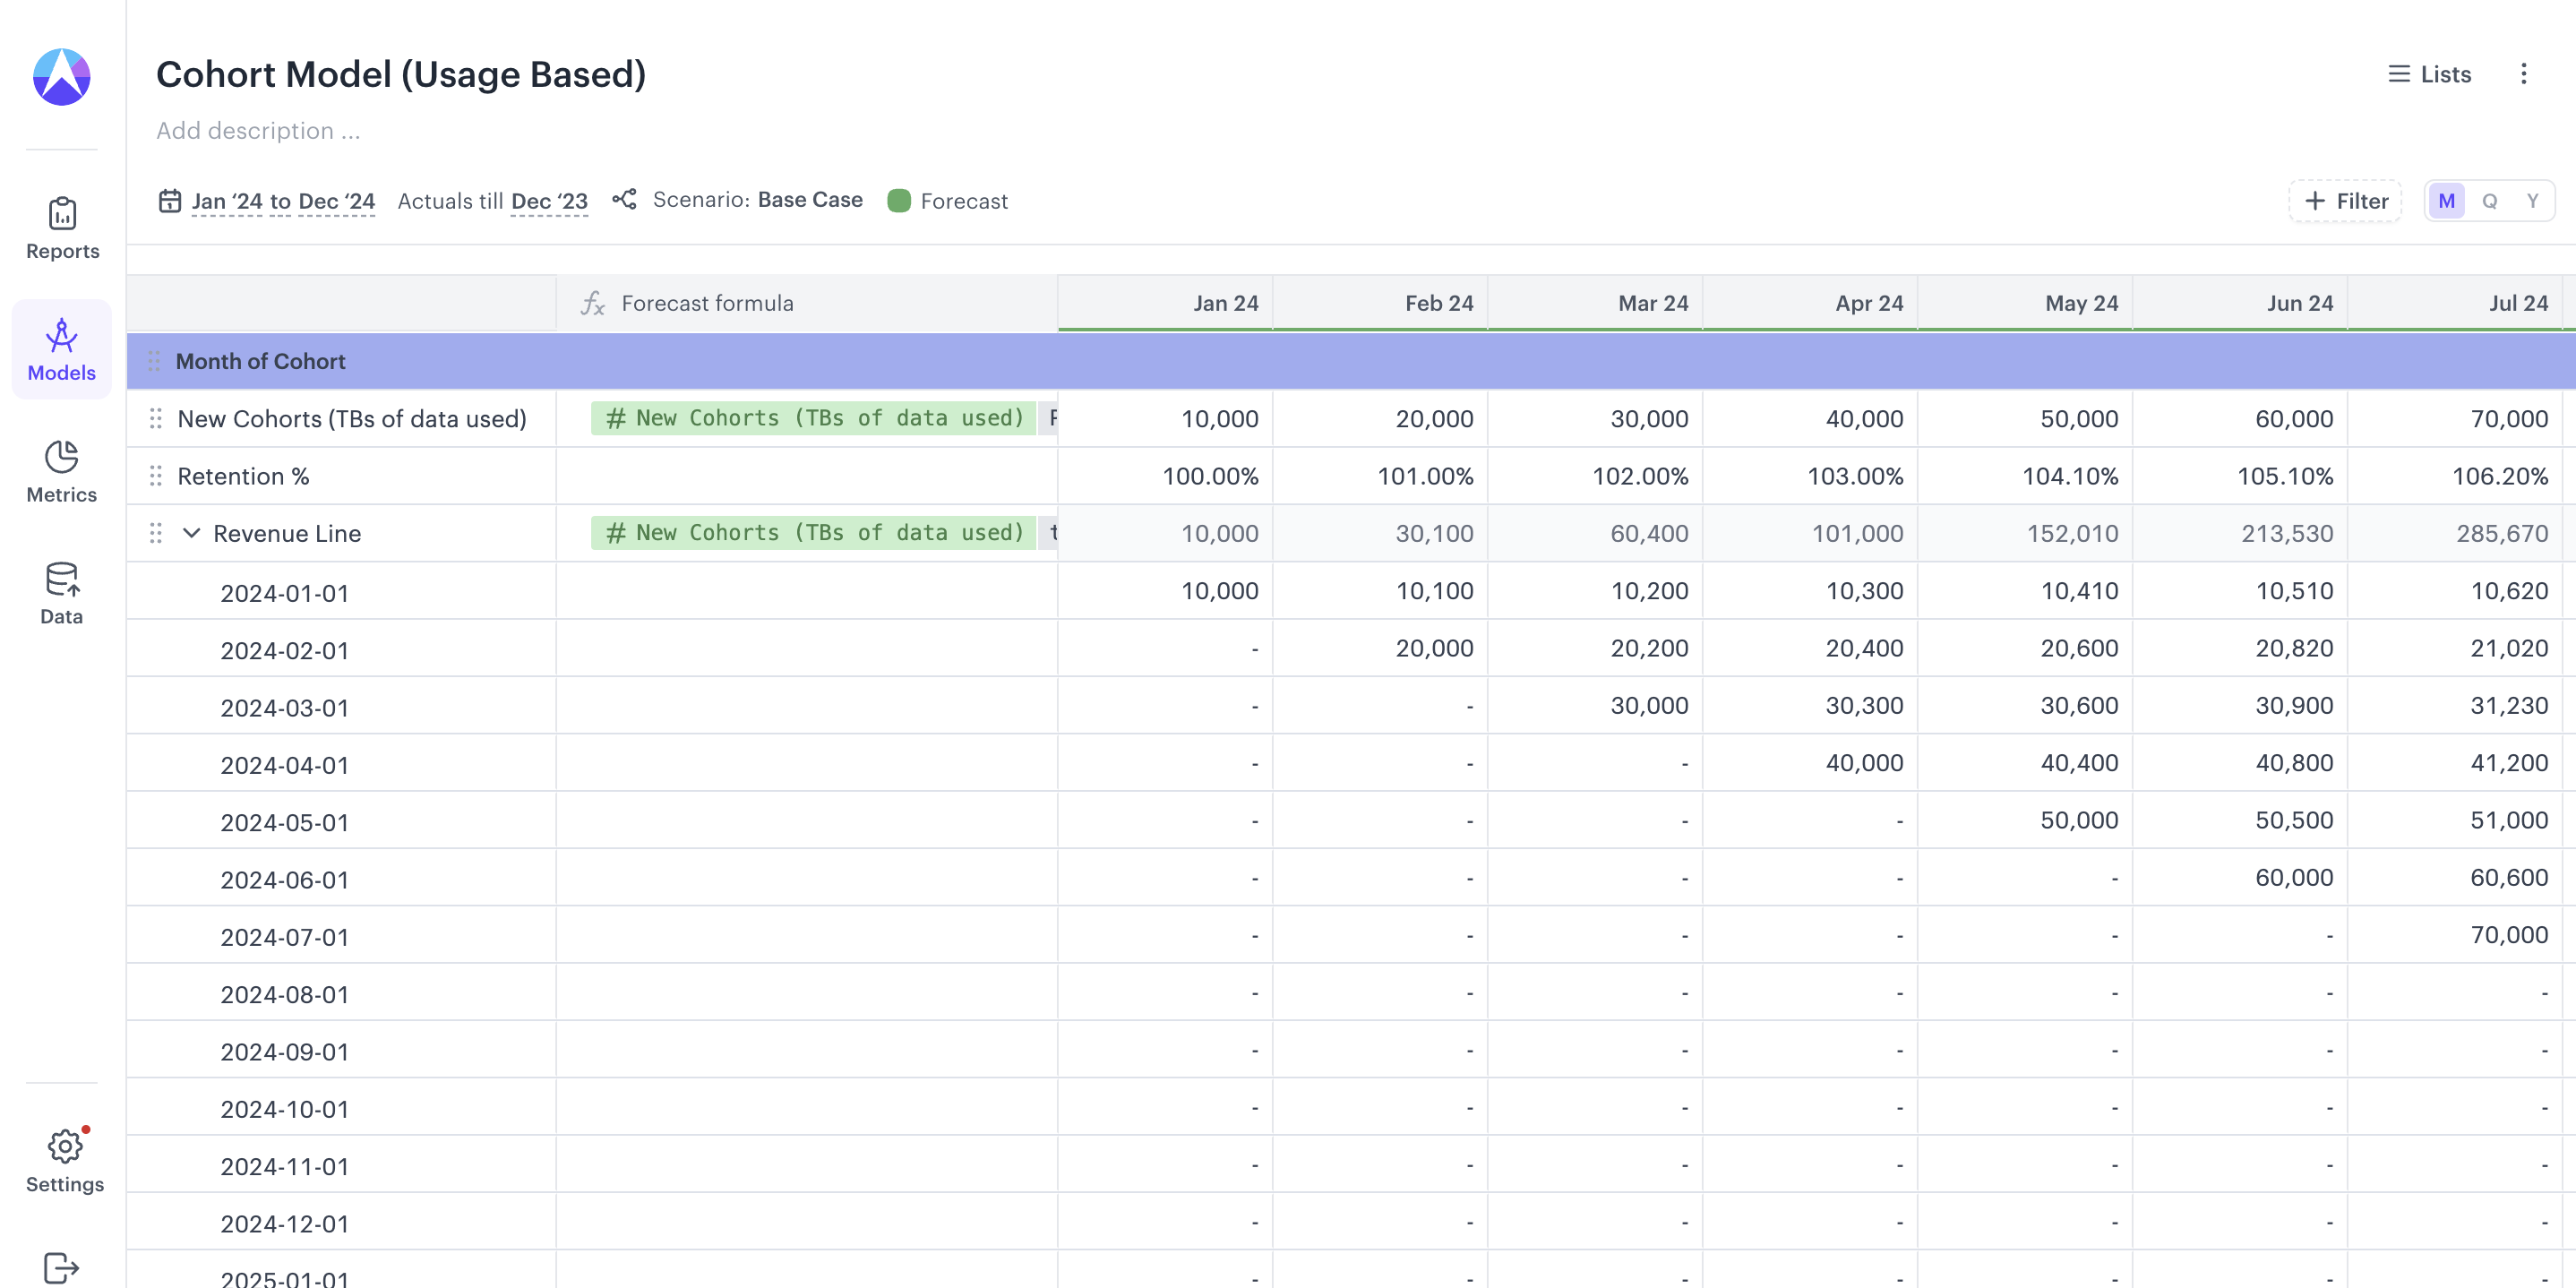
Here, you need a purpose-built financial planning and analysis (FP&A) software. Drivetrain is one of the most robust SaaS financial planning software solutions in the market today. With its powerful calculation engine, you can build highly complex financial models, model different scenarios, conduct what-if analysis to test your ideas, and create flexible forecasts. And with a user-friendly interface that offers the familiarity and ease of Excel spreadsheets, doing all of these things is fast and easy.
Here’s a rundown of some of the key features that Drivetrain offers to facilitate your usage-based revenue forecasting process:
- Automated data consolidation and analysis: You can easily consolidate and reconcile the data you need from different systems and tools into a single source of truth in real time. Further, with over 200 integrations with source systems, Drivetrain eliminates the need for manual entry of data, making it more time and effort friendly. You can also slice and dice the data per your business requirements.
- Model maintainability: This feature helps replace multiple spreadsheets and the resulting challenges, such as version control issues, formula syntax errors, wrong cell references, access control issues, and collaboration difficulties. With role-based access, multiple users and teams can work on the same document, keeping it updated and accurate.
- Scalability: As SaaS businesses evolve, their financial forecasting and modeling becomes more complex. Spreadsheets have limited features in this situation, especially since FP&A software like Drivetrain can easily make adjustments to their forecasts and financial models to reflect changing business dynamics, market conditions, etc., without significant manual effort or disruption.
- Strategic decision-making: By providing insights into key financial metrics and performance indicators, Drivetrain facilitates more informed and effective decision-making around pricing strategies, customer acquisition, resource allocation, etc.
Learn how Drivetrain can simplify your usage-based revenue forecasting processes.


.webp)


.svg)